The Performance Paradox: Why High CTR Often Masks a Dying Pipeline (And Why Your LLM Can't Diagnose It)
The Performance Paradox: Why High CTR Often Masks a Dying Pipeline (And Why Your LLM Can't Diagnose It)
Executive Summary
In high-spend LinkedIn and B2B advertising environments, teams frequently encounter a devastating contradiction: CTR remains healthy or even improves, while ROAS and pipeline quality crater. This post diagnoses the "Engagement Trap"—the structural divergence between surface-level engagement signals (CTR) and commitment signals (pipeline revenue). We argue that CTR measures Attention Efficiency while pipeline measures Revenue Outcome, and when these metrics diverge, it signals your campaigns are optimizing toward the wrong north star. More critically, general-purpose LLMs cannot diagnose this paradox because they lack continuous performance intelligence, cross-funnel attribution data, account-level behavioral patterns, and the temporal correlation models required to connect early-stage engagement to late-stage revenue outcomes. Solving this requires specialized ad intelligence systems that track the relationship between creative characteristics and downstream conversion quality over time.
1. The Paradox: When "Good" Metrics Lie
You've seen this dashboard story unfold:
CTR looks healthy at 0.8%+ or is actively improving month-over-month
Ad Spend is stable or scaling according to plan
MQLs/Leads continue flowing into your CRM at consistent volume
Cost per Lead may even be declining
YET: Pipeline quality is deteriorating, Sales is complaining about "junk" leads, conversion rates from MQL to SQL are dropping, and ROAS is quietly dying
This isn't a data error. It's a structural signal that your optimization strategy has decoupled engagement from intent.
The Brutal Reality: CTR and Pipeline do not move together by default. CTR measures the efficiency of a pattern interrupt in someone's feed. Pipeline measures the density of buyer intent in your targeting. These are fundamentally different phenomena, and optimizing for one can actively destroy the other.
2. Defining CTR: Reaction vs. Intent
To fix the funnel, we must strip CTR of its implied authority as a success metric.
What CTR Actually Measures
Curiosity: A user wondering "What is this?" or "Why is everyone talking about this?"
Pattern Interruption: A bright color, contrarian headline, or visually surprising creative that breaks scroll momentum
Social Proof Momentum: High comment counts or engagement signals that trigger FOMO clicks
Emotional Reaction: Anger, surprise, or intrigue that compels a tap—regardless of relevance
Scroll Fatigue: Users clicking because they're bored, not because they're buyers
What CTR Systematically Ignores
Buying Readiness: Clicking an ad doesn't mean a budget exists, a problem is urgent, or a buying committee is formed
Account Fit: High CTR often comes from the widest, least qualified edge of your audience—individual contributors, students, job seekers, competitors, or adjacent roles with no purchasing authority
Economic Intent: In enterprise B2B, CTR frequently peaks before pipeline quality does because "tourists" click more readily than "buyers"
Decision-Making Context: Whether the clicker is in-market, has authority, faces the pain point you solve, or works at a target account
Competitive Displacement: Whether your message is differentiated or just "interesting enough to click but not compelling enough to buy"
Key Insight: CTR is an attention efficiency metric that measures reaction speed. It is not—and has never been—a revenue proxy. Conflating the two is the foundational mistake that creates the engagement trap.
3. The Four Structural Reasons for CTR-Pipeline Divergence
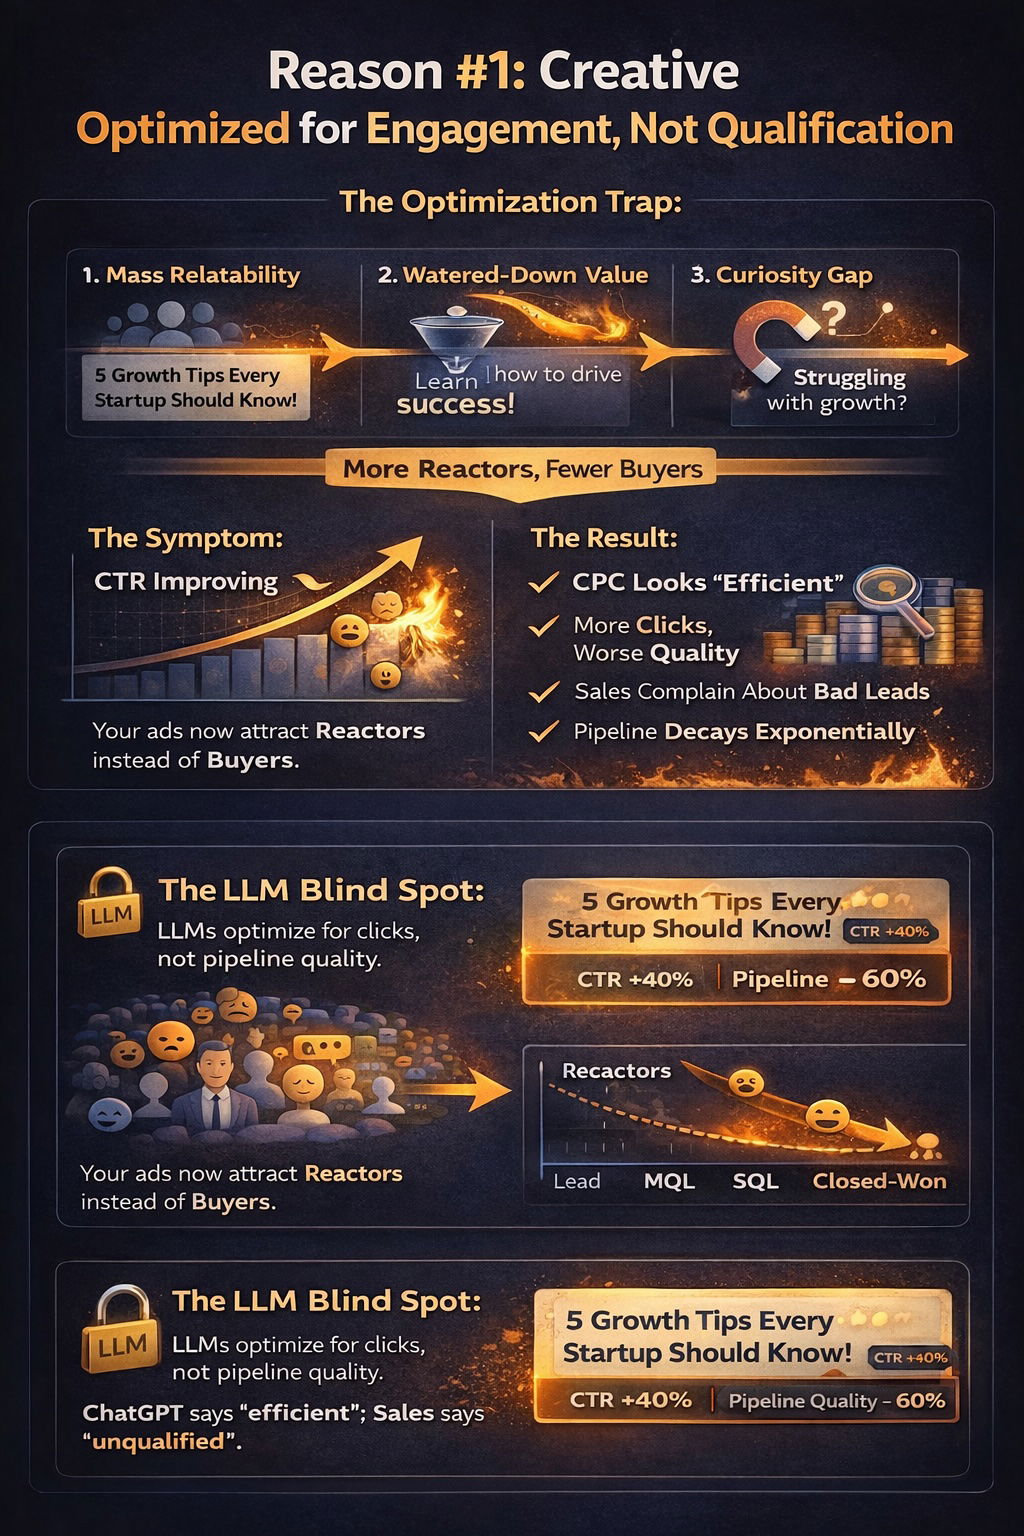
Reason 1: Creative Optimized for Engagement, Not Qualification
When you train an algorithm (LinkedIn's delivery system) or optimize creative (via A/B testing or LLM suggestions) to maximize clicks, the system finds the "path of least resistance" to engagement.
The Optimization Trap:
Headlines get optimized for mass relatability or intrigue rather than technical relevance
Value propositions get watered down to appeal to broader audiences
Specificity (which filters for buyers) gets replaced with curiosity gaps (which attract browsers)
Pain points become generic ("struggling with growth?") instead of precise ("spending 40+ hours/month on manual pipeline reconciliation?")
The Symptom: Your CTR improves, but your ads now attract Reactors instead of Buyers.
The Result:
CPC looks efficient on the surface
Volume of clicks increases
But downstream conversion rates from Lead → MQL → SQL → Closed-Won decay exponentially
Sales complains that leads "aren't qualified" or "don't understand what we do"
The "hook" that drove the click didn't include the qualification filters that separate browsing from buying intent
The LLM Blind Spot: When you paste ad copy into ChatGPT and ask for optimization, the LLM optimizes for linguistic appeal and persuasive structure—it cannot warn you that your "optimized" headline will increase CTR by 40% while decreasing pipeline quality by 60% because it has no visibility into this correlation.
Reason 2: Audience Saturation & Declining Buyer Density
As you hit the same addressable audience repeatedly over weeks and months, a deceptive pattern emerges: CTR may hold steady or even improve due to familiarity inflation and creative fatigue mitigation tactics, but your actual "Net-New Demand Generation" has been exhausted.
The Frequency Trap:
Your ads achieve frequency levels of 6.0–7.0+ within your target segments
CTR stabilizes because the remaining "active clickers" have self-selected as "engaged"
But these aren't new buyers—they're the same people who've seen your ad 6–10 times and still haven't converted
The Symptom: Dashboards show "healthy engagement metrics" while pipeline contribution per dollar spent collapses.
The Result:
You're paying for "repeat engagement" from the same non-converting personas
Actual buying committees within target accounts have either (a) already converted, (b) actively rejected your offer, or (c) become banner-blind
New account penetration stalls while you continue spending against saturated audience segments
Your "efficient CTR" is coming from non-buyers who find your ads entertaining but aren't in-market
The LLM Blind Spot: LLMs cannot detect audience saturation because they have no visibility into frequency data, audience overlap across campaigns, or the temporal pattern of engagement decay. They cannot tell you "your CTR is healthy but you're burning budget on exhausted segments."
Reason 3: Creative-Audience Misalignment (The "Wrong Clicks" Problem)
High CTR from the wrong audience is worse than low CTR from the right audience—but most optimization approaches cannot distinguish between them.
The Targeting Drift:
Your creative resonates strongly with a persona, but not your persona
Example: An ad about "AI automation" gets high CTR from data scientists and engineers (who click to learn) but low CTR from operations executives (who actually buy)
LinkedIn's algorithm optimizes toward "whoever clicks" and begins preferentially delivering to the high-engagement (but low-value) segment
Your targeting parameters stay the same, but delivery shifts toward non-buyers
The Result:
CTR improves as the algorithm finds "easy clicks"
But lead quality deteriorates because you're attracting the wrong job functions, wrong seniority levels, or wrong company sizes
Marketing sees "efficient performance," Sales sees "garbage leads"
The LLM Blind Spot: When analyzing ad copy in isolation, LLMs cannot predict which personas will engage vs. which will convert. They lack the audience behavioral data that shows "question-based hooks get 3x CTR from analysts but half the conversion rate compared to outcome-focused hooks for VPs."
Reason 4: Attribution Blindness & The Time-Lag Gap
CTR is a real-time metric that captures early-stage curiosity in a single session. ROAS is realized 3–9 months later in B2B enterprise sales cycles. This temporal disconnect creates systematic misattribution.
The Time-Window Trap:
Marketing dashboards report on 30-day or 90-day windows
B2B buying cycles span 6–12 months with multiple touchpoints
High CTR today might correlate with pipeline created 6 months from now—or might have zero correlation
You're measuring Immediate Responsiveness but judging Long-Term Outcomes
The Symptom: Dashboards collapse different buyer journey stages into unified time windows, making it impossible to see which early-stage engagement patterns predict late-stage conversion.
The Result:
A "viral" creative drives massive CTR this month, gets celebrated, and scaled
Six months later, pipeline analysis reveals that cohort converted at 40% below baseline
But by then, you've spent hundreds of thousands on that creative direction
The feedback loop is too slow to prevent optimization toward the wrong signal
The LLM Blind Spot: LLMs have no concept of time-lagged attribution. They cannot tell you "this headline style gets great CTR but converts 50% worse 6 months downstream" because they lack access to longitudinal conversion data linked to specific creative characteristics.
4. The Dashboard Problem: Descriptive vs. Diagnostic Intelligence
Most B2B advertising dashboards are designed to show what moved, not why performance degraded or what will happen next.
The Structural Limitations of Standard Dashboards
Speed Bias: Dashboards optimize for metrics that update quickly:
Impressions (real-time)
Clicks (real-time)
CTR (real-time)
Cost per Click (real-time)
While the metrics that actually matter update slowly or require external data integration:
Pipeline quality (90–180 day lag)
Sales acceptance rates (30–60 day lag)
Closed-Won attribution (180+ day lag)
Account penetration density (requires CRM + ad platform integration)
The Synthesis Gap:
Ad platforms know about clicks and impressions
CRMs know about lead quality and pipeline
But almost no one has integrated systems that connect creative characteristics → engagement patterns → lead quality → pipeline outcomes across the full temporal span of B2B buying cycles
The Result: You're flying blind through a 6-month time lag, making optimization decisions based on engagement signals that have unclear or negative correlation with revenue outcomes.
Why LLMs Make This Worse
When marketers upload ads to ChatGPT or Gemini for optimization, they're typically sharing:
Ad copy text
Maybe some basic performance metrics (CTR, CPC)
Occasionally competitor examples
What they're NOT sharing (because they can't):
How this creative's CTR correlates with 6-month pipeline quality
Which specific headline structures drive high CTR from non-buyers vs. buyers
Whether this ad's engagement pattern matches high-performing or low-performing historical cohorts
Account-level signals about buying committee engagement vs. individual browsing behavior
Frequency and saturation dynamics within target segments
The LLM's Response: The LLM analyzes the text using general copywriting principles and suggests "improvements" that will likely increase CTR (because that's what "good ad copy" does) without any ability to warn you that those changes will destroy pipeline quality.
It's optimization in a vacuum—linguistic optimization disconnected from business outcomes.
5. The Missing Intelligence: What You Actually Need
Solving the CTR-Pipeline paradox requires intelligence that general-purpose LLMs fundamentally cannot provide:
1. Continuous Performance Correlation Tracking
What's Needed: Systems that track creative characteristics (headline structure, value prop positioning, CTA type, visual style) and correlate them with downstream conversion quality across 6–12 month windows.
Why LLMs Can't Do This: They see your ad once, in isolation, with no historical context or forward-looking outcome data.
Example Intelligence:
"Question-based headlines in your account drive 2.1x CTR but convert to pipeline at 0.6x the rate of outcome-focused headlines"
"Ads mentioning specific ROI metrics underperform on CTR by 15% but outperform on SQL→Opp conversion by 40%"
"Your highest-CTR creative from Q3 is now showing 60% pipeline degradation in cohort analysis"
2. Account-Level Behavioral Pattern Recognition
What's Needed: Analysis of whether clicks come from isolated individuals or represent buying committee engagement across multiple roles within target accounts.
Why LLMs Can't Do This: They have no access to account-level behavioral data, buying committee signals, or professional graph intelligence.
Example Intelligence:
"Creative A drives 1.2% CTR but 80% of clicks come from individual contributors with no buying authority"
"Creative B drives 0.7% CTR but 60% of clicks represent multi-stakeholder engagement from target accounts"
"High CTR is coming from accounts outside your ICP—you're optimizing for the wrong audience density"
3. Audience Saturation & Frequency Dynamics
What's Needed: Real-time monitoring of how performance metrics change as frequency increases and new account penetration declines.
Why LLMs Can't Do This: They have no visibility into delivery data, frequency distributions, or audience overlap patterns.
Example Intelligence:
"CTR is stable at 0.9% but 70% of impressions are going to accounts you've already reached 8+ times"
"New account discovery has declined 45% while frequency has increased to 6.8—you're in saturation mode"
"High-performing accounts are showing declining engagement—creative refresh needed"
4. Temporal Attribution Modeling
What's Needed: Systems that connect early-stage engagement patterns to late-stage conversion outcomes and can predict which current metrics will correlate with future pipeline quality.
Why LLMs Can't Do This: They cannot access CRM data, cannot track cohorts over time, and have no concept of B2B buying cycle dynamics.
Example Intelligence:
"Ads with >1.2% CTR historically show 30% pipeline degradation at 6 months in your account"
"Current creative is following the engagement pattern of your worst-converting cohort from Q2"
"High CTR in weeks 1-2 followed by steep decline predicts poor pipeline quality—this is happening now"
5. Platform-Specific Enforcement & Quality Signals
What's Needed: Understanding of how LinkedIn's quality scoring, auction dynamics, and delivery algorithms respond to different creative characteristics—and how those platform behaviors correlate with business outcomes.
Why LLMs Can't Do This: They're trained on general knowledge, not on proprietary platform algorithms or quality scoring systems.
Example Intelligence:
"This headline structure triggers LinkedIn's 'low relevance' penalty, reducing delivery efficiency"
"Ads with this CTA style get high CTR but low LinkedIn quality scores, increasing CPM by 40%"
"Your creative is optimized for clicks but LinkedIn's auction is penalizing you for low conversion rate"
6. Competitive Context & Message Saturation
What's Needed: Analysis of how your messaging performs relative to competitor ad saturation and market message fatigue.
Why LLMs Can't Do This: They cannot access competitor ad creative, market saturation data, or real-time competitive intelligence.
Example Intelligence:
"Your positioning on 'AI-powered efficiency' has 40% message overlap with 12 competitors in your space"
"Market saturation for this value prop has increased 3x in 90 days—differentiation declining"
"Competitors shifted messaging 6 weeks ago; your creative now blends into feed patterns"
6. Replacement Signals: What to Monitor Instead of CTR
If CTR is failing as a North Star metric, transition to Higher-Order Signals that better predict pipeline quality:
1. CTR Variance Analysis
Is one creative outlier driving all the clicks while others fail? (Signal of "Clickbait" vs. Strategy)
Are you seeing bimodal CTR distributions that suggest different audience segments responding differently?
How does CTR correlate with other engagement signals (time on landing page, scroll depth, return visits)?
2. Frequency vs. Net-New Account Coverage
Are you reaching more accounts, or just the same accounts more frequently?
What's your new account discovery rate trending?
How does performance change at frequency 3, 5, 7, 10+?
What percentage of your spend goes to audiences who've already rejected your offer?
3. Account-Level Signal Density
Are multiple stakeholders from the same target account engaging, or just isolated individuals?
Does engagement represent buying committee breadth or individual curiosity?
Are clicks coming from decision-makers or influencers without authority?
What's the account-level conversion rate (accounts clicking → accounts in pipeline)?
4. Time-Lagged Conversion Quality
Analyze the quality of leads generated 90–180 days ago vs. their CTR at the time of creation
Do high-CTR creatives predict high pipeline contribution 6 months later?
Which creative characteristics show positive correlation between engagement and conversion?
Are you tracking cohort-based performance or just aggregated metrics?
5. Engagement Depth Beyond the Click
What happens after the click? (Bounce rate, time on site, pages per session)
Are high-CTR ads also driving high landing page engagement?
Form completion rate for visitors from different creatives
Content engagement signals (video completion, asset downloads, return visits)
6. Sales-Accepted Lead Rate by Creative
Which ads drive leads that Sales actually accepts vs. rejects?
MQL→SQL conversion rate segmented by source creative
Sales feedback quality scores by campaign
Pipeline velocity (time to close) for different creative approaches
7. Reframe the Question
Instead of asking: "Why is our CTR healthy but pipeline quality is deteriorating?"
The strategic leader asks: "What behavior are we optimizing for—and is that behavior predictive of revenue, or just predictive of attention?"
If your CTR is improving while ROAS declines, the system isn't "broken." It's working exactly as designed—it's just designed toward the wrong outcome.
The Deeper Questions:
Are we measuring efficiency or effectiveness? (CTR is efficiency; pipeline contribution is effectiveness)
Are we optimizing for speed or quality? (Clicks happen instantly; qualified pipeline takes months)
Are we tracking cohorts or aggregates? (Aggregate CTR hides deteriorating cohort quality)
Are we testing or learning? (A/B tests optimize for immediate signals; learning requires longitudinal analysis)
Do we have integrated intelligence or siloed dashboards? (Pipeline paradoxes emerge at the integration layer)
8. Why This Matters More Than Ever
The rise of LLM-assisted ad optimization is accelerating the engagement trap because:
LLMs are brilliant at linguistic optimization (making copy more compelling, clearer, more persuasive)
LLMs have no concept of pipeline correlation (they optimize text, not business outcomes)
Marketers assume linguistic improvement = performance improvement (this is categorically false in B2B)
The feedback loop is too slow to correct (by the time you realize "optimized" ads destroyed pipeline, you've wasted quarters and budget)
The Result: Teams are systematically optimizing their ads toward higher engagement and worse business outcomes, faster than ever before, with more confidence than ever before.
9. What Actually Works: Purpose-Built Pipeline Intelligence
Solving the CTR-Pipeline paradox requires purpose-built systems that:
Combine Multiple Intelligence Layers:
LLM capabilities for creative variation and linguistic analysis
Continuous platform monitoring of engagement patterns
CRM integration for conversion outcome tracking
Temporal correlation models linking creative → engagement → pipeline
Account-level behavioral analysis from professional graph data
Competitive intelligence about message saturation and positioning
Platform-specific quality signals and auction dynamics
Predictive models that forecast pipeline impact before you scale spend
Enable Diagnostic Questions Like:
"Which of my current ads will crater pipeline quality in 6 months?"
"Is my high CTR coming from buyers or browsers?"
"Am I exhausting my addressable market or generating net-new demand?"
"What creative characteristics predict qualified pipeline in my specific context?"
"Where is the divergence point between engagement efficiency and revenue effectiveness?"
These systems don't exist in general-purpose LLMs. They require specialized infrastructure that connects ad platforms, CRM systems, professional behavioral data, and temporal correlation models.
10. The Path Forward
If you're experiencing the CTR-Pipeline paradox:
Immediate Actions:
Audit your high-CTR creatives for qualification rigor—are they filtering for buyers or attracting browsers?
Segment CTR by persona and seniority—where is engagement actually coming from?
Track frequency dynamics—what percentage of your "healthy CTR" is repeat engagement from saturated audiences?
Implement cohort tracking—analyze 90-day and 180-day conversion quality by source creative
Integrate qualitative Sales feedback—which campaigns drive leads that Sales actually wants?
Strategic Shifts:
Redefine success metrics from engagement efficiency to pipeline efficiency
Build temporal correlation models that connect early signals to late outcomes
Invest in integrated intelligence that spans ad platforms + CRM + behavioral data
Challenge the CTR orthodoxy in campaign reviews and optimization discussions
Stop optimizing ads in LLM isolation—demand outcome-correlated intelligence
Organizational Changes:
Align Marketing and Sales on lead quality definitions and feedback loops
Extend attribution windows to match actual buying cycles (6–12 months, not 30 days)
Create cross-functional dashboards that show engagement→pipeline→revenue flow
Educate stakeholders on the difference between reaction metrics and commitment metrics
Resist pressure to optimize for vanity metrics when they conflict with business outcomes
11. Looking Ahead: The Creative Decay Signal
CTR-Pipeline divergence is just one manifestation of a deeper problem: Creative Decay—the systematic deterioration of ad effectiveness that's invisible in engagement metrics but devastating in pipeline impact.
In our next post, we'll break down how to detect Creative Decay at the account level before it shows up as pipeline deterioration, including:
Early warning signals in engagement pattern changes
Frequency-adjusted performance metrics
Audience saturation indicators
Message fatigue detection frameworks
Predictive models for creative refresh timing
The Core Argument: Creative Decay and Account Intent are separate, independent variables that require distinct measurement frameworks. Conflating them—or optimizing one while ignoring the other—is how high-CTR campaigns destroy pipeline.
12. Conclusion: The Tyranny of Engagement Metrics
The CTR-Pipeline paradox reveals a fundamental truth about modern B2B advertising: What's easy to measure (engagement) is not what matters (revenue), and what matters is hard to measure.
General-purpose LLMs make this worse by providing sophisticated optimization without outcome correlation. They help you write more compelling ads without any ability to warn you that "more compelling" often means "more engagement from non-buyers."
The solution isn't to stop using LLMs—they're powerful tools. The solution is to recognize their fundamental limitations:
LLMs optimize language, not business outcomes
LLMs see snapshots, not temporal patterns
LLMs analyze text, not behavioral correlations
LLMs improve engagement, not pipeline quality
Effective B2B advertising requires outcome-correlated intelligence—systems that connect creative characteristics to downstream revenue impact across the full temporal span of complex buying cycles.
Until you have that intelligence, optimizing for CTR is a coin flip: you might get lucky, or you might systematically destroy your pipeline while your engagement metrics look phenomenal.
The question isn't whether your CTR is good. The question is: what revenue outcome does that CTR predict, and are you measuring the right correlation?
Further Reading & Resources
Contributing: Found a blind spot we missed? Experienced this paradox in your campaigns? Open an issue or submit a PR. This document evolves as we learn more about the engagement-pipeline disconnect.
Discussion: What's your experience with CTR-Pipeline divergence? How are you measuring pipeline correlation in your campaigns? Join the conversation in Issues.
License: MIT - Feel free to share, adapt, and use this content with attribution.
Related Posts:
[Upcoming] Detecting Creative Decay Before Pipeline Impact
[Upcoming] Account Intent vs. Individual Engagement: Measuring What Matters